When Earnings Announcements Go After 4 PM

Posted by Mengjie Xu on Monday, July 1, 2024

Introduction

Unlike the market during trading hours, the after-hours market is characterized by an illiquid trading environment, high trading costs, a high degree of information asymmetry, low trading volume, and most importantly, relatively ‘inactive’ market participants (Barclay and Hendershott, 2004 JF), all making it challenging to trace information incorporation and price discovery in the after-hours market.

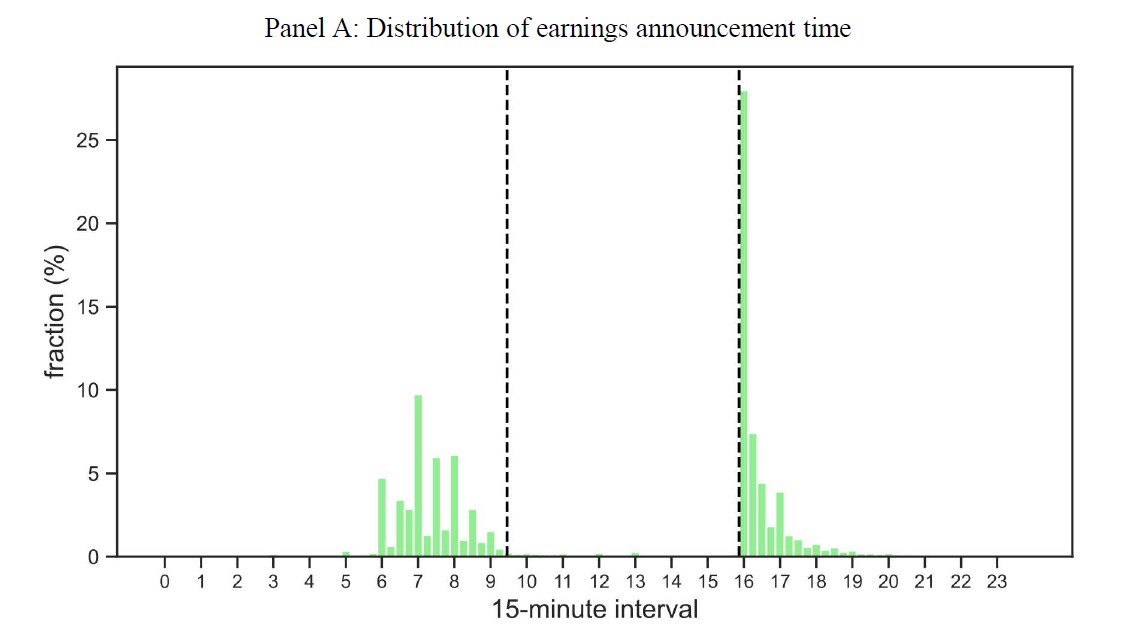
On the other hand, to avoid the excess volatility during the trading hours and allow more time for investors to acquire and integrate the information into their valuation assessments, firms and regulators have become more prone to release material news outside trading hours in recent years. Take the firms’ earnings announcements as an example. Figure 1 from Chan and Marsh (2024, WP) plots the intraday distribution of earnings announcement frequencies in recent years. In contrast to the situation decades ago, when over 80% of earnings announcements were released during trading hours (Patell and Wolfson, 1982 TAR), after-hour earnings announcements have become dominant nowadays.

In this blog post, I will introduce how to trace minute-level price discovery in the after-hours market, thereby generating insights into how material news released after 4:00 p.m. is incorporated into stock prices.


Figure 1: Intraday Distribution of Eearnings Announcements (Chan and Marsh, 2024 WP)

Global Data Input

My global input file cq_tsymbol_date.txt in this blog post is a dataset with three columns, Ticker, Dates and Surprise. This dataset has 10,742 observations, covering 1,496 distinct stock tickers (ticker) and 722 distinct earnings announcement dates (dates) spanning from 2015 to 2018. On the other hand, 72.50% of observations have earnings Surprise greater than or equal to 0 in this sample, which means these firms meet or beat the mean analyst forecast.

As these earnings announcements are all released between 4:00 p.m. and 4:15 p.m., I am particularly interested in how the stock prices change since 4:00 p.m.

Ticker Dates Surprise
LNDC 20150106 0
SHLM 20150106 0.01
NSIT 20160428 -0.06
SPNC 20160428 -0.03
RPAI 20180731 -0.01
FISV 20180731 0.01

Overarching Implementation Tips

Insights from the following three papers guided and shaped the implementation of price discovery analysis for the after-hours market in this blog post.

  • Gregoire and Martineau (2022, JAR) find that using trade prices instead of quote prices underestimates the speed and magnitude of price discovery in the after-hours market. They provide practical recommendations accordingly.
  • Holden and Jacobsen (2014, JF) caution that the NBBO (National Best Bid and Offer) order book accessible via the WRDS-TAQ database is incomplete. However, it is possible to construct the complete NBBOs by combining the quote records and the incomplete NBBOs.
  • Hu and Stephan (2022, TAR) highlight the necessity of paying extra attention to the highly volatile 4:00-to-4:01 p.m. period when analyzing after-hours trading.

Trade vs Quote Prices (Gregoire and Martineau, 2022 JAR)

The practical recommendations from Gregoire and Martineau (2022, JAR) are as follows. In the after-hours market,

  • Use adjustments in best ask price to trace price discovery following positive news (earnings surprises), and adjustments in best bid price to trace price discovery following negative news (earnings surprises).
  • If the direction of news is not clear, use changes in mid-quotes instead of trade prices to trace the price discovery.

According to Gregoire and Martineau (2022, JAR), the rationales are:

  • While trade in after-hours market is indeed sparse, the placed orders with information content are not as sparse. It’s just that many of these orders are not successfully executed.
    • Therefore, using trade instead of quote prices to compute returns would omit a considerable part of meaningful price discovery.
  • In addition, there is an asymmetry in the speed of adjustment: following a positive surprise, the best ask price is adjusted much more quickly than the best bid price, and vice versa for negative surprises.
    • That said, conditional on the direction of news, using trade prices (or even mid-quotes) would underestimate both the speed and the magnitude of the price discovery.

Incomplete NBBO Orderbook (Holden and Jacobsen, 2014 JF)

As we are particularly interested in tracing the changes in the best bid and ask prices following the recommendations from Gregoire and Martineau (2022, JAR), the NBBO (National Best Bid and Offer) orderbook accessible via WRDS-TAQ database seems to be a good start.

However, Holden and Jacobsen (2014, JF) note that the NBBO order book from the WRDS-TAQ database does NOT contain the complete NBBO because when one exchange has both the best bid and best offer, it is only noted in the quote file, not the NBBO file. In such cases, the field “National BBO Ind” is set equal to 1 (for NYSE, AMEX, and regional stocks) or else the field “NASDAQ BBO Ind” is set equal to 4 (for NASDAQ stocks) in the quote file. The NBBO file in WRDS-TAQ database is therefore incomplete for it is missing these records. Readers can find more details in the footnotes 6 and 24 in Holden and Jacobsen (2014, JF) .

That said, one may need to complete NBBO order book by incorporating additional information from the quote file, if necessary. I guess a natural question here is How “incomplete” the NBBOs readily accessible from the WRDS-TAQ database could be?

Well, it turns out that 37.63% of my 10,742 observations have quotes-free NBBO records. However, for those exposed to NBBOs from quote records, the contribution of the quote records could be significant. See the distribution of the percentage of quote records in the complete NBBO changes in the following table.

Mean S.D. P1 P25 Median P75 P99
NBBOs from Quotes (%) 30.19 29.69 0.00 0.00 26.90 52.54 95.40

To directly evaluate the impact of NBBO completeness on price discovery analysis in the after-hours market, I plotted in Figure 2 the bid price adjustments relative to the price at 3:59 p.m. following negative earnings announcements in my sample (qsurprise = 1 in Step 5) using the COMPLETE and INCOMPLETE NBBOs, respectively (the patterns are similar for positive news). Figure 2 indicates that the incompleteness of NBBOs underestimates both the speed and magnitude of price discovery, but the magnitude seems tolerable for readers who just want a quick overview of the price discovery dynamics.


Figure 2: Impact of NBBOs' Completeness

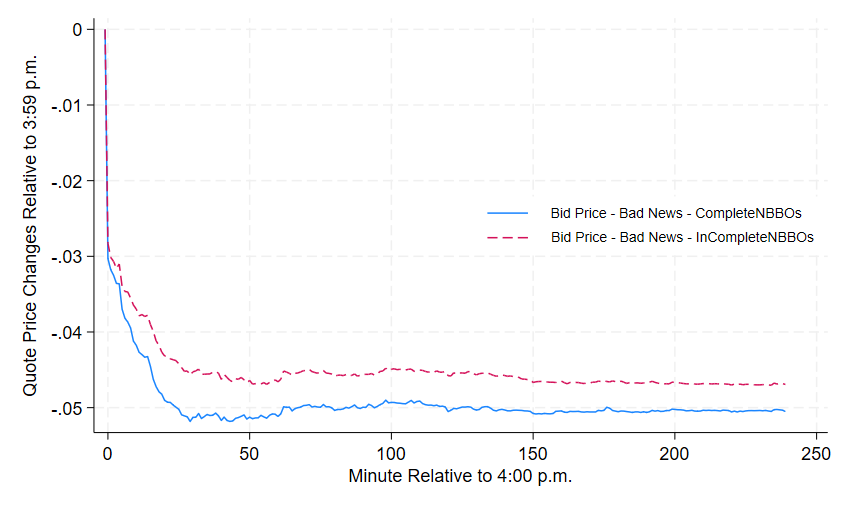
While these statistics are apparently limited to my personal sample, which is not necessarily representative, I hope they offer some relevant information for readers to decide whether it is necessary to complete the NBBOs in the after-hours market analysis.

Volatile 4:00-to-4:01 p.m. Period (Hu and Stephan, 2022 TAR)

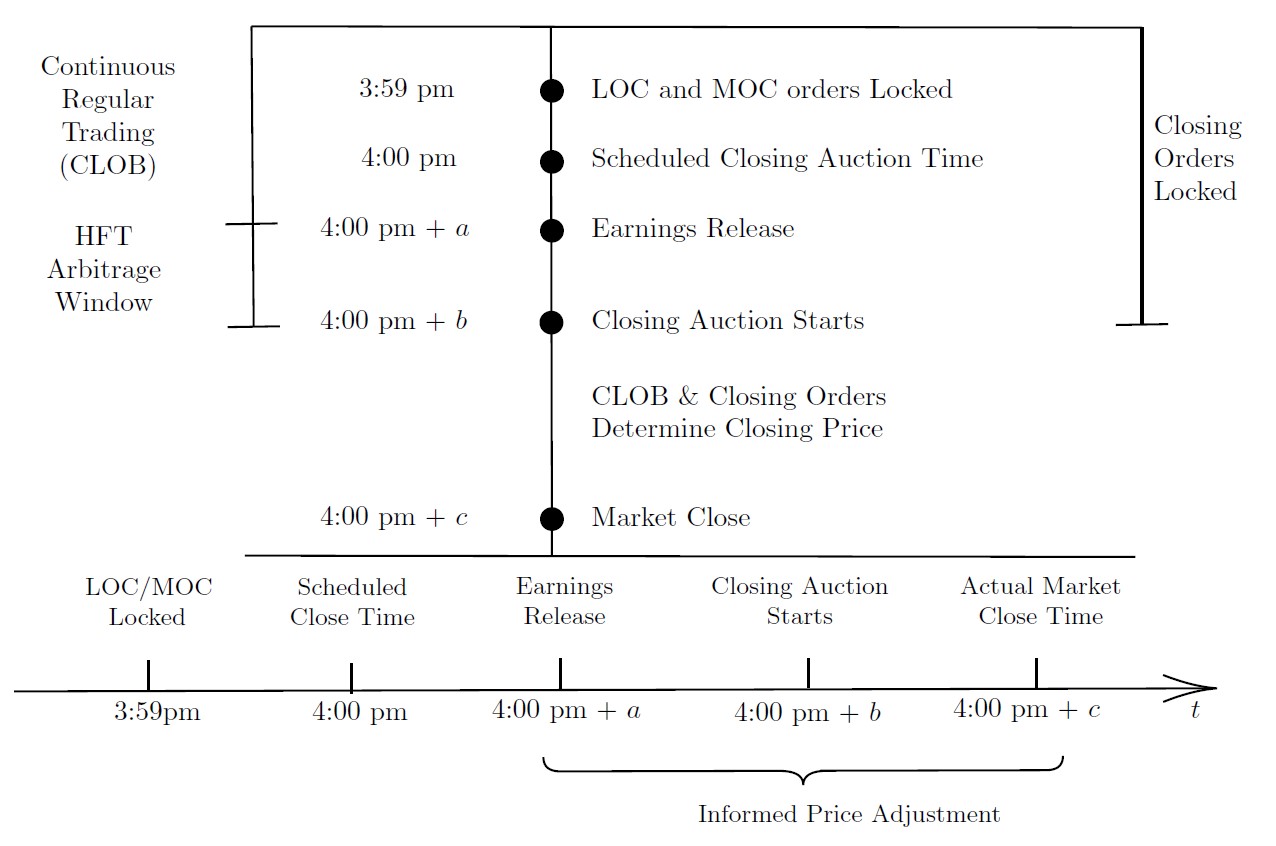
Hu and Stephan (2022, TAR) pointed out that due to the design of major exchanges’ closing processes, the 4:00-to-4:01 p.m. period is much more volatile and informative than other after-market hours. The mechanics behind this highly volatile one-minute immediately after 4:00 p.m. are as follows.

There is a delay between the official exchange closing time of 4:00 pm and the actual market closing time, which can last from a fraction of a second to one minute. During this short-lived period, exchanges facilitate the closing auctions, and market participants can still submit or modify orders via the continuous limit order book (CLOB). Whenever material news such as an earnings announcements are released and disseminated during this brief market closing process (for a while many firms do release earnings precisely at 4:00 p.m.), speed traders are able to incorporate the news into their trading before the market closes. This can result in significant and informed price adjustments from the 4:00 pm price to the final closing price.


Figure 3: Market Micro-Structure for Highly Volatile 4:00-to-4:01 p.m.

An illustrative anecdote about this volatile market closing process comes from Ulta Salon Cosmetics & Fragrance Inc. (ULTA) releasing its earnings at 4:00 p.m. on December 5, 2013. Readers can find more details in the Wall Street Journal’s article.

Although recent SEC mandates have addressed some loopholes in major exchanges’ closing procedures (e.g.,the Nasdaq and NYSE’s guidance in November 2015 and the SEC’s mandates in 2017), I recommend readers remain cautious about the once highly volatile 4:00-to-4:01 p.m. period and separate this period from subsequent ones if necessary.

Implementation

While conceptually guided by the three papers mentioned above, the codes for after-hours price discovery analysis in this post are greatly inspired by those from Holden and Jacobsen (2014, JF), which are publicly accessible on Craig Holden’s website. Although Holden and Jacobsen (2014, JF) focus on the daily or monthly price discovery WITHIN trading hours, many of their functions can extend to the intraday after-hour analysis (e.g., the removal of abnormal quote records, the calculation of time-weighted quote spreads and market depth, etc.).

Step 1: Download the After-Hours NBBOs (Quotes)

To start, we need to download the quotes and the NBBO (National Best Bid and Offer) orderbook, which are both available in the WRDS-TAQ database. Readers who are not familiar with WRDS-TAQ database can find background information about this database in my previous post Extract High-frequency Data via PC SAS.

The codes are as follows. Readers can replace cqm_ with nbbom_ to download NBBO files. Note that I use the data step instead of proc sql here to query for the stocks releasing the earnings announcements on a specified day, as the former has higher querying efficiency. Intuitively, the data step only involves picking observations with certain criteria from the daily TAQ dataset, while proc sql practically merges the whole daily TAQ dataset with the input data we provided. Although the difference is negligible with smaller datasets, using data step can be 50% faster when dealing with the large high-frequency daily TAQ dataset (over 20 GB).

This step will produce 722 output files named like taqout_cq_yyyymmdd and another 722 named like taqout_nbbo_yyyymmdd, each storing the after-hours quotes or nbbos for firms releasing earnings on date yyyymmdd.

 1
 2
 3
 4
 5
 6
 7
 8
 9
10
11
12
13
14
15
16
17
18
19
20
21
22
23
24
25
26
27
28
29
30
31
32
33
34
35
36
37
38
39
40
41
42
43
44
45
46
47
48
49
50
51
52
53
54
55
56
57
58
59
60
61
62
63
64
65
66
67
68
69
70
71
72
73
74
75
76
77
78
79
80
81
82
83
84
85
86
87
88
/* Assign the Home Directory */
libname home "D:\FullAuctionTAQ\TAQ_output_0411_new";

/* Connect To WRDS Server */
%let wrds = wrds.wharton.upenn.edu 4016;
options comamid=TCP remote=WRDS;
signon username=_prompt_;
run;

/* Import first two columns of the Global Input File */
filename input 'D:\Request After Hour Quotes\cq_tsymbol_date.txt'; 
data dictionary2;
	infile input dlm = "," dsd missover;
	input ticker $ dates yymmdd8.;
	yyyymmdd=input(put(dates,yymmddn8.), best12.);
run;

/* Download The Quotes In After-Hours */
/* The Following Codes Are Run In The WRDS Server */
rsubmit;
	/* Upload The Imported Global Input File To WRDS Server */
	proc upload data=dictionary2 out=dictionary2; run;
	
	/* Select Distinct Earnings Announcement Dates */
	proc sql noprint;
	  select distinct yyyymmdd into :datesValsM separated by ' ' 
	  from dictionary2;
	quit;  
	
	/* Define A Function (Named Getdaily) To Download After-Hour Quotes For All Stocks */ 
	/* With Earnings Releases On A Specified Day */
	%macro getdaily(yyyymmdd);
		
		/* Pick Out All The Observations Having Earnings Releases On The Specified */
		/* Day From The Imported Global Input File */
		data datainput;
			set dictionary2;
			where yyyymmdd = &yyyymmdd;
		run;
		
		/* Select All The Distinct Stock Tickers To A Macro Variable Named Ticklist */
		proc sql noprint;
		  select distinct ticker into :ticlist separated by ' '
		  from datainput;
		quit;  
		
		/* Format The Macro Variable Ticklist To A String Named Ticlist_Formatted */
		data _null_;
		  length temp $20000;
		  temp=cat('"',tranwrd("&ticlist."," ",'" "'),'"');
		  call symput('ticlist_formatted',temp);
		run;
		
		/* Print The Date Currently Being Processed */
		%put &yyyymmdd;
		/* Print The Formatted String Ticlist_Formatted */
		%put &ticlist_formatted.;
		
		/* Select The After-Hour Quotes Of Stocks Having Earnings Releases On That Day */
		data taqout_cq_&yyyymmdd;
	    	set taqmsec.cqm_&yyyymmdd;
			where sym_root in ( &ticlist_formatted.) and sym_suffix = ''
			and time_m ge "15:59:000"t;
			format date date9.;
			format time_m TIME20.9;
		run;
		
		/* Download The Quotes */
		proc download data=taqout_cq_&yyyymmdd out=home.taqout_cq_&yyyymmdd; run;
	%mend;
	
	/* Define The Function Iterate To Execute The Function Getdaily Day By Day */
	/* And Download Quotes For All Distinct Dates In The Global Input File */
	%macro iterate();	
		%let i=1;
		%let yyyymmdd=%scan(&datesValsM,&i);

		%do %while("&yyyymmdd" ~= "");
			%if %sysfunc(exist(taqmsec.cqm_&yyyymmdd)) %then %getdaily(&yyyymmdd) ;
		   	%let i = %eval(&i + 1);
			%let yyyymmdd=%scan(&datesValsM,&i);
		%end;
	%mend;
	
	/* Execute The Function Iterate */
	%iterate();

endrsubmit;

Step 2: Clean the NBBOs

Step 2.1 Remove Abnormal Records

I follow Holden and Jacobsen (2014, JF) and remove abnormal or missing nbbo records, outputing records with changes in best quote price or depth. The codes are as follows.

  1
  2
  3
  4
  5
  6
  7
  8
  9
 10
 11
 12
 13
 14
 15
 16
 17
 18
 19
 20
 21
 22
 23
 24
 25
 26
 27
 28
 29
 30
 31
 32
 33
 34
 35
 36
 37
 38
 39
 40
 41
 42
 43
 44
 45
 46
 47
 48
 49
 50
 51
 52
 53
 54
 55
 56
 57
 58
 59
 60
 61
 62
 63
 64
 65
 66
 67
 68
 69
 70
 71
 72
 73
 74
 75
 76
 77
 78
 79
 80
 81
 82
 83
 84
 85
 86
 87
 88
 89
 90
 91
 92
 93
 94
 95
 96
 97
 98
 99
100
101
102
103
104
105
106
107
108
109
110
111
112
/* Define a function to clean nbbo for a specified date yyyymmdd */
%macro cleannbbo(yyyymmdd);
	/* Clean the DTAQ NBBO file */ 
	data NBBO;
	    set home.taqout_nbbo_&yyyymmdd;

	    /* Quote condition must be normal (i.e., A, B, H, O, R, W) */
	    if Qu_Cond not in ('A','B','H','O','R','W') then delete;

	    /* If canceled then delete */
	    if Qu_Cancel='B' then delete;

	    /* If both ask and bid are set to 0 or . then delete */
	    if ask le 0 and bid le 0 then delete;
	    if asksiz le 0 and bidsiz le 0 then delete;
	    if ask = . and bid = . then delete;
	    if asksiz = . and bidsiz = . then delete;

		/* Create spread and midpoint */
	    Spread=ask-bid;
	    Midpoint=(ask+bid)/2;

		/* If size/price = 0 or . then price/size is set to . */
	    if ask le 0 then do;
	        ask=.;
	        asksiz=.;
	    end;
	    if ask=. then asksiz=.;
	    if asksiz le 0 then do;
	        ask=.;
	        asksiz=.;
	    end;
	    if asksiz=. then ask=.;
	    if bid le 0 then do;
	        bid=.;
	        bidsiz=.;
	    end;
	    if bid=. then bidsiz=.;
	    if bidsiz le 0 then do;
	        bid=.;
	        bidsiz=.;
	    end;
	    if bidsiz=. then bid=.;

		/*	Bid/Ask size are in round lots, replace with new shares variable*/
		BidsizeShares = bidsiz * 100;
		AsksizeShares = asksiz * 100;
	run;
	
	/* Get Previous Midpoint */
	proc sort 
	    data=NBBO (drop = bidsiz asksiz);
	    by sym_root  date;
	run; 

	data NBBO2;
	    set NBBO;
	    by sym_root date;
	    lmid=lag(Midpoint);
	    if first.sym_root  or first.date then lmid=.;
	    lm25=lmid-2.5;
	    lp25=lmid+2.5;
	run;

	/* If the quoted spread is greater than $5.00 and the bid (ask) price is less
	   (greater) than the previous midpoint - $2.50 (previous midpoint + $2.50), 
	   then the bid (ask) is not considered. */

	data NBBO2;
	    set NBBO2;
	    if Spread gt 5 and bid lt lm25 then do;
	        bid=.;
	        bidsizeShares=.;
	    end;
	    if Spread gt 5 and ask gt lp25 then do;
	        ask=.;
	        asksizeShares=.;
	    end;
		if bid=. then delete;
		if ask=. then delete;
		keep date time_m sym_root Qu_SeqNum bid bidsizeShares 
	         ask asksizeShares ;
	run;

	/* Output new NBBO records - identify changes in NBBO records 
	   (changes in price and/or depth) */

	data NBBO2;
	    set NBBO2;
	    if sym_root ne lag(sym_root) 
	       or date ne lag(date) 
	       or ask ne lag(ask) 
	       or bid ne lag(bid) 
	       or asksizeShares ne lag(asksizeShares) 
	       or bidsizeShares ne lag(bidsizeShares); 
	run;
	
	/* If the NBBO contains two quotes in the exact same microsecond, assume 
	   last quote (based on sequence number) is the active one */
	proc sort data=NBBO2;
	    by sym_root date time_m descending Qu_SeqNum;
	run;

	proc sort data=NBBO2 nodupkey;
	    by sym_root date time_m;
	run;
	
	/* Save the output file as cleanednnbos_&yyyymmdd */
	data home.cleanednnbos_&yyyymmdd */;
		set NBBO2;
	run;
%mend;

Step 2.2: Obtain the Complete NBBO

Given that the NBBO order book downloaded directly from the WRDS-TAQ database is incomplete, I follow Holden and Jacobsen (2014, JF) and complete it by incorporating additional information from quote files. Readers can find more details about this in the footnotes 6 and 24 in Holden and Jacobsen (2014, JF).

Note that I tag the source as Ori_NBBO if the NBBO record change is detected based on the directly accessed NBBO file from the WRDS-TAQ database, and as Quotes if the NBBO record change is detected based on quote records.

 1
 2
 3
 4
 5
 6
 7
 8
 9
10
11
12
13
14
15
16
17
18
19
20
21
22
23
24
25
26
27
28
29
30
31
32
33
34
35
36
37
38
39
40
41
42
43
44
45
46
47
48
49
50
51
52
53
54
55
56
57
58
59
60
61
62
63
64
65
66
67
68
69
70
71
72
73
74
75
76
77
78
79
80
81
82
83
84
85
%macro getcompletenbbo(yyyymmdd);
	data NBBO2;
		set home.cleanednnbos_&yyyymmdd;
		source = "Ori_NBBO";
	run;
	
	/* Clean WRDS-TAQ quotes data */
	data quoteAB;
	    set home.taqout_cq_&yyyymmdd;

	    /* Create spread and midpoint */
	    Spread=Ask-Bid;

	    /* Delete if abnormal quote conditions */
	    if Qu_Cond not in ('A','B','H','O','R','W') then delete; 

	    /* Delete if abnormal crossed markets */
	    if Bid>Ask then delete;

	    /* Delete abnormal spreads */
	    if Spread>5 then delete;

	    /* Delete withdrawn quotes. This is when an exchange temporarily has no quote,
	       as indicated by quotes with price or depth fields containing values less 
	       than or equal to 0 or equal to '.'. See discussion in Holden and
	       Jacobsen (2014), page 11.  */
	      
	    if Ask le 0 or Ask =. then delete;
	    if Asksiz le 0 or Asksiz =. then delete;
	    if Bid le 0 or Bid =. then delete;
	    if Bidsiz le 0 or Bidsiz =. then delete;
	    drop Sym_Suffix Qu_Cancel RPI SSR FINRA_ADF_MPID SIP_Message_ID
	         Spread NATL_BBO_LULD;
	run;
	
	/* Pick out nbbos only in quotes file */
	data quoteAB2;
	    set quoteAB;
	    where (Qu_Source = "C" and NatBBO_Ind='1') 
	       or (Qu_Source = "N" and NatBBO_Ind='4');
		
	    /* Bid/Ask size are in round lots, replace with new shares variable
	       and rename Best_BidSizeShares and Best_AskSizeShares */
	    BidSizeShares = Bidsiz * 100;
	    AskSizeShares = Asksiz * 100;

		source = "Quote";

	    keep date time_m sym_root Qu_SeqNum Bid 
	         BidSizeShares Ask AskSizeShares source;
	run;
	
	/* Combine NBBOs from two sources */
	proc sort data=NBBO2;
	    by sym_root date Qu_SeqNum;
	run;

	proc sort data=quoteAB2;
	    by sym_root date Qu_SeqNum;
	run;

	data OfficialCompleteNBBO;
	    set NBBO2 quoteAB2;
	    by sym_root date Qu_SeqNum;
		
		/* Create spread and midpoint */
	    Spread=Ask-Bid;
	    Midpoint=(Ask+Bid)/2;
	run;

	/* If the NBBO contains two quotes in the exact same microsecond, assume 
	   last quote (based on sequence number) is the active one */
	proc sort data=OfficialCompleteNBBO;
	    by sym_root date time_m descending Qu_SeqNum;
	run;

	proc sort data=OfficialCompleteNBBO nodupkey;
	    by sym_root date time_m;
	run;
	
	/* Save the output file as officialcompletenbbo_&yyyymmdd */
	data home.officialcompletenbbo_&yyyymmdd;
		set officialcompletenbbo;
	run;
%mend

Step 2.3 Execute the NBBO-cleaning Functions

Having defined the functions to clean NBBO files (cleannbbo) and to get the complete NBBOs (getcompletenbbo), we need to execute these functions date by date.

For a quick overview of the after-hours market, it seems okay to skip the completion of NBBOs. Readers who perceive sufficient to conduct analysis based on the the NBBOs directly from WRDS-TAQ database may comment line 25 in the following code block.

If you comment line 25, this step will produce 722 separate files with names like cleanednnbos_&yyyymmdd, storing the cleaned NBBO records directly from WRDS-TAQ database. If you don’t, there will be additional 722 files with names like officialcompletenbbo_&yyyymmdd, storing the complete NBBO records augmented from quote records.

 1
 2
 3
 4
 5
 6
 7
 8
 9
10
11
12
13
14
15
16
17
18
19
20
21
22
23
24
25
26
27
28
29
30
31
32
/* Assign the Home Directory */
libname home "D:\FullAuctionTAQ\TAQ_output_0411_new";

/* Import Global Input File */
filename input 'D:\Request After Hour Quotes\cq_tsymbol_date.txt'; 
data dictionary2;
	infile input dlm = "," dsd missover;
	input ticker $ dates yymmdd8.;
	yyyymmdd=input(put(dates,yymmddn8.), best12.);
run;

/* Select Distinct Earnings Announcement Dates */
proc sql noprint;
	select distinct yyyymmdd into :datesValsM separated by ' ' 
	from dictionary2;
quit;  

/* Get Cleaned NBBOs Day by Day */
%macro iteratenbbo();
	%let i=1;
	%let yyyymmdd=%scan(&datesValsM,&i);

	%do %while("&yyyymmdd" ~= "");
		%cleannbbo(&yyyymmdd);
		%getcompletenbbo(&yyyymmdd);
		%let i = %eval(&i + 1);
	%let yyyymmdd=%scan(&datesValsM,&i);
	%end;
%mend;

/* Execute The Function Iterate */
%iteratenbbo();

Step 3: Merge (Complete) NBBOs for Analysis

Up to this step, we have obtained the cleaned (complete) NBBO files by the date of earnings announcements. For ease of later analysis, I will merge all the cleaned NBBO files stored in 722 separate files into one file.

Implementation-wise, I first obtain all the filenames in the directory that stores the cleaned NBBO files, then select all files with names starting with officialcompletenbbo (or cleanednnbos if you commented line 25 in Step 2.3), and finally combine all the data from these selected files into one integrated file named nbbos_officialcompletenbbo (or nbbos_cleanednnbos).

 1
 2
 3
 4
 5
 6
 7
 8
 9
10
11
12
13
14
15
16
17
18
19
20
21
22
23
24
25
26
27
28
29
30
31
32
33
34
35
36
37
38
39
40
41
42
43
44
45
46
47
48
49
50
51
52
53
54
55
56
57
58
/* Assign the Home Directory */
libname home "D:\FullAuctionTAQ\TAQ_output_0411_new";

/* Assign the same directory path to the macro variable 'dir' */
%let dir=D:\FullAuctionTAQ\TAQ_output_0411_new;

/* Collect all the file names in the directory */
%macro collectnbbos(nbbotype);
	%let strtype = "%sysfunc(tranwrd(&nbbotype,%str( ),%str(%" %")))";

	data files;
	    /* Initializes the file reference variable 'fref' with the value "DIR" */
	    fref = "DIR";
	    
	    /* Checks if the directory can be assigned to the file reference variable */
	    if filename(fref,"&dir.") = 0 then do;
	        /* Opens the directory and assigns its ID to 'did' */
	        did = dopen(fref);
	        
	        /* Checks if the directory was successfully opened */
	        if did ne 0 then do;
	            /* Loops through each file in the directory */
	            do i = 1 to dnum(did);
	                /* Reads the name of the ith file in the directory */
	                name = dread(did,i);
	                
	                /* Checks if the file has a '.sas7bdat' extension (SAS dataset) */
					 /* Keep files with name starting with 'officialcompletenbbo' */
	                if scan(name,-1,".") = "sas7bdat" and scan(name, 1, "_") = &strtype then output;
	            end;
	            /* Closes the directory */
	            did = dclose(did);
	        end;
	        /* Clears the file reference variable */
	        rc = filename(fref);
	    end;
	    /* Keeps only the 'name' variable in the output dataset */
	    keep name;
	run;

	/* Add the reference library for these selected datasets */
	/* The results are put into a macro variable 'nbbolist', separated by spaces */
	proc sql noprint;
	    select distinct cat("home.", scan(name,1,".")) into :nbbolist separated by ' '
	    from files;
	quit;


	/* Creates a new dataset 'home.nbbos_&nbbotype' */
	/* Sets (appends) all datasets listed in the 'nbbolist' macro variable */
	data home.nbbos_&nbbotype;
	    set &nbbolist;
	run;
%mend;

/* Execute The Function collectnbbos */
%collectnbbos(officialcompletenbbo);
/*%collectnbbos(cleanednnbos);*/

Step 4: Output Minute-Level Quote Prices, Spreads, and Market Depths

Now that we have all the record changes in national best bid and offers (NBBOs) during the after-hours (from 4:00 p.m. to 8:00 p.m.), we can output the data for further analysis depending on the granularity that best fits the research purpose. Given that the WRDS-TAQ database provides microsecond timestamps since July 2015 and nanosecond timestamps starting from October 2016, the nanosecond granularity could be the theoretical maximum. However, I guess most research does not need to go that far.

Here I will conduct the analysis in the minute level, which is presumably sufficient enough for most research purposes. For each earnings announcement in my sample, the following code will calculate the maximum time-weighted spreads and market depth within each minute, as well as the best bid/ask price at the end of each minute in after-hours. I output these prices/spreads/depths to a csv file named QuoteSpread_officialcompletenbbo.csv for subsequent drawing of stylized patterns in Stata.

 1
 2
 3
 4
 5
 6
 7
 8
 9
10
11
12
13
14
15
16
17
18
19
20
21
22
23
24
25
26
27
28
29
30
31
32
33
34
35
36
37
38
39
40
41
42
43
44
45
46
47
48
49
50
51
52
53
54
55
56
57
58
59
60
61
62
63
64
65
66
67
68
69
70
71
72
73
74
75
76
77
78
79
%macro getquotedspreads(nbbotype);
	/* Determine the trading minute relative to 4 p.m. */
    data NBBO2;
        set home.nbbos_&nbbotype;
        min = floor((time_m-"16:00:00.000000000"t)/60);
    run;
	
	/* Time each quote is in force - if last quote of the minute, then quote is */
	/* inforce until the beginning of the next mminute */
    proc sort data=NBBO2;
        by sym_root date min descending time_m;
    run;

	data QSpread1;
	    set NBBO2;
	    by sym_root date min;
		benchtime = "16:00:00.000000000"t+60*(min+1);
		format benchtime time20.3;
		inforce=abs(dif(time_m));
		if first.min
	    then inforce=benchtime-time_m;
		midquote=(ask+bid)/2;
	run;
	
	data QSpread2;
	    set QSpread1;
		/* Delete Locked and Crossed Quotes */
	    if ask=bid or ask<bid then delete;
		/* Multiply Dollar Quoted Spread, Percent Quoted Spread, Best Dollar 
	   	Depth, and Best Share Depth by time_m Inforce */
	    wQuotedSpread_Dollar=(ask-bid)*inforce;
	    wQuotedSpread_Percent=(log(ask)-log(bid))*inforce;
	    wBestOfrDepth_Dollar=ask*asksizeShares*inforce;
	    wBestBidDepth_Dollar=bid*bidsizeShares*inforce;
	    wBestOfrDepth_Share=asksizeShares*inforce;
	    wBestBidDepth_Share=bidsizeShares*inforce;
	run;

	
	proc sql;
	    create table QuotedSpreadsandDepths 
	    /* Find Average for spreads/depths and last record for quote price */
	    /* Across Firm-Min */ 
	    as select sym_root,date,min,bid,ask,midquote,time_m,
	    sum(inforce) as sumtime,
	    sum(wQuotedSpread_Dollar) as swQuotedSpread_Dollar,
	    sum(wQuotedSpread_Percent) as swQuotedSpread_Percent,
	    sum(wBestOfrDepth_Dollar) as swBestOfrDepth_Dollar,
	    sum(wBestBidDepth_Dollar) as swBestBidDepth_Dollar,
	    sum(wBestOfrDepth_Share) as swBestOfrDepth_Share,
	    sum(wBestBidDepth_Share) as swBestBidDepth_Share 
	    from QSpread2 
	    group by sym_root,date,min 
		having time_m=max(time_m);
	quit;
	
	/* Calculate Time-Weighted Dollar Quoted Spread, Percent Quoted Spread, 
	   Best Dollar Depth, and Best Share Depth */
	data home.QuoteSpread_&nbbotype;
	    set QuotedSpreadsandDepths;
	    QuotedSpread_Dollar=swQuotedSpread_Dollar/sumtime;
	    QuotedSpread_Percent=swQuotedSpread_Percent/sumtime;
	    BestOfrDepth_Dollar=swBestOfrDepth_Dollar/sumtime;
	    BestBidDepth_Dollar=swBestBidDepth_Dollar/sumtime;
	    BestOfrDepth_Share=swBestOfrDepth_Share/sumtime;
	    BestBidDepth_Share=swBestBidDepth_Share/sumtime;
		drop swQuotedSpread_Dollar swQuotedSpread_Percent 
	         swBestOfrDepth_Dollar swBestBidDepth_Dollar
	         swBestOfrDepth_Share swBestBidDepth_Share;
	run;
	
	/* Output to CSV file */
	%let outfile = %sysfunc(cat(D:\FullAuctionTAQ\TAQ_output_0411_new\QuoteSpread_, &nbbotype, .csv));
	%let outfile = "%sysfunc(tranwrd(&outfile,%str( ),%str(%" %")))";
	proc export data=home.QuoteSpread_&nbbotype outfile=&outfile dbms=csv replace; run;
%mend;

%getquotedspreads(officialcompletenbbo);
/*%getquotedspreads(cleanednnbos);*/

Step 5: Draw Stylized Patterns

Here, readers can already fit the data outputs to their research agenda already. To provide an example, I draw the bid price changes for negative earnings surprises and the ask price changes for positive earnings surprises, respectively, similar to what Gregoire and Martineau (2022, JAR) did.

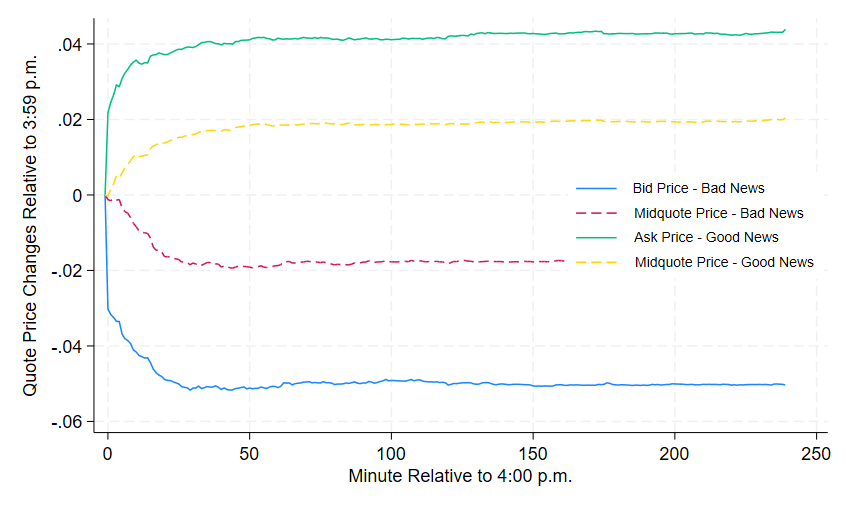
In particular, I group my firm-date observations into three ranked groups based on the earnings surprises, Surprise. The dummy variable qsurprise equals 1 for firms with the lowest Surprise and therefore the most negative news, and 3 for firms with the highest Surprise and therefore the most positive news. Then I plotted in Figure 4 the minute-level quote price changes for positive (qsurprise=3) and negative news (qsurprise=1) respectively.

Patterns in Figure 4 kind of validate my methods in this post.

  • Consistent with Gregoire and Martineau (2022, JAR), they show that it would be better to use bid price changes for tracking price discovery after bad news, and ask price changes for positive news. Using mid-quotes underestimates both the speed and magnitude of price discovery regardless of the news direction, not to mention when using trade prices.
  • Consistent with Hu and Stephan (2022, TAR) , they show that there is a considerable price jump in the first minute following 4:00 p.m. More importantly, these price jumps seems to be highly informed, as they are consistent with the news directions.

Figure 4: Minute-level Quote Price Changes Following Earnings Announcements in After-hours

The codes for drawing these patterns are as follows.

 1
 2
 3
 4
 5
 6
 7
 8
 9
10
11
12
13
14
15
16
17
18
19
20
21
22
23
24
25
26
27
28
29
30
31
32
33
34
35
36
37
38
39
40
41
42
43
44
45
46
47
48
49
50
51
52
53
* Prepare the global input file to provide earnings surprise quantiles
import delimited cq_tsymbol_date.txt, clear
rename v1 sym_root
rename v2 date
rename v3 surprise
tostring date, force replace
transferdate3 date "YMD"

* group the observations to three ordered groups based on earnings surprises
xtile qsurprise=surprise, nq(3)

save cq_tsymbol_date, replace

* clean the sas outputs, set the panel
cap program drop cleanraw
cap program define cleanraw
	import delimited QuoteSpread_`1'.csv, clear
	g xid = date+sym_root
	encode xid, g(xcode)

	xtset xcode min
	tsfill, full
	xfill sym_root date xid, i(xcode)

	foreach var of varlist bid ask midquote quotedspread_dollar quotedspread_percent{
		by xcode: replace `var'=`var'[_n-1] if `var'==.
	}

	foreach var of varlist bid ask midquote{
		by xcode: g `var'_deltaprc=`var'/`var'[1]-1
	}

	foreach var of varlist *depth*{
		by xcode: replace `var'=0 if `var'==.
	}

	transferdate3 date "DMY" 
	joinby sym_root date using cq_tsymbol_date
	
	save QuoteSpread_`1', replace

end 

cleanraw officialcompletenbbo
*cleanraw cleanednnbos

* plot stylized patterns
use QuoteSpread_officialcompletenbbo, replace

collapse (mean) bid ask midquote *spread* *depth* *deltaprc*, by(qsurprise min)

* plot the quote price changes for positive/negative news
graph twoway (line bid_deltaprc min if qsurprise==1)||(line midquote_deltaprc min if qsurprise==1)||(line ask_deltaprc min if qsurprise==3)||(line midquote_deltaprc min if qsurprise==3) if inrange(min, -1, 239), legend(label(1 "Bid Price - Bad News") label( 2 "Midquote Price - Bad News") label( 3 "Ask Price - Good News") label( 4 "Midquote Price - Good News") ring(0) al(bottom) j(right) size(small))  graphregion(color(white)) xtitle("Minute Relative to 4:00 p.m.") ytitle("Quote Price Changes Relative to 3:59 p.m.")

Summary

In this blog post, I display a workflow of conducting minute-level price discovery analysis in the after-hours market. Although the post uses the more prevalent after-hours earnings announcements in the recent years as the motivating example, the techniques introduced should also suffice for the exploration of other material news likely released in the after-hours, such as conference calls, analysts’ recommendations, SEC disclosures, and so on. In addition, the granularity of the analysis could also be easily extended to a higher frequency, such as the second level or beyond, depending the readers’ research needs.

Reference

  1. Patell, James M., and Mark A. Wolfson. “Good news, bad news, and the intraday timing of corporate disclosures.” The Accounting review (1982): 509-527.
  2. Chan, Kam Fong, and Terry Marsh. “Overnight post-earnings announcement drift and SEC Form 8-K disclosures.” Available at SSRN (2024).
  3. Lewis, Michael. Flash boys: a Wall Street revolt. WW Norton & Company, 2014.
  4. Barclay, Michael J., and Terrence Hendershott. “Liquidity externalities and adverse selection: Evidence from trading after hours.” The Journal of Finance 59, no. 2 (2004): 681-710.
  5. Bryzgalova, Svetlana, Anna Pavlova, and Taisiya Sikorskaya. “Retail trading in options and the rise of the big three wholesalers.” The Journal of Finance 78, no. 6 (2023): 3465-3514.
  6. deHaan, Ed, Jiacui Li, and Edward M. Watts. “Retail bond investors and credit ratings.” Journal of Accounting and Economics 76, no. 1 (2023): 101587.
  7. Gregoire, Vincent, and Charles Martineau. “How is earnings news transmitted to stock prices?.” Journal of Accounting Research 60, no. 1 (2022): 261-297.
  8. Hu, Danqi, and Andrew Stephan. “News at the Bell and a Level Playing Field.” The Accounting Review 97, no. 6 (2022): 357-384.
  9. Holden, Craig W., and Stacey Jacobsen. “Liquidity measurement problems in fast, competitive markets: Expensive and cheap solutions.” The Journal of Finance 69, no. 4 (2014): 1747-1785.