Motivation
Bloomberg has integrated massive data from various of data vendors. However, as a typical finance terminal designed for traders, it’s technically hard to use as a database for scholars. This blog will introduce how to prepare your Bloomberg Terminal for massive data extracting and how to access data via Bloomberg API.
Deploy Operation Enviornment
Bloomberg Access
-
Get a Bloomberg Terminal and of course a valid Bloomberg Account
-
Make sure the Bloomberg Add-in in Excel in this terminal works
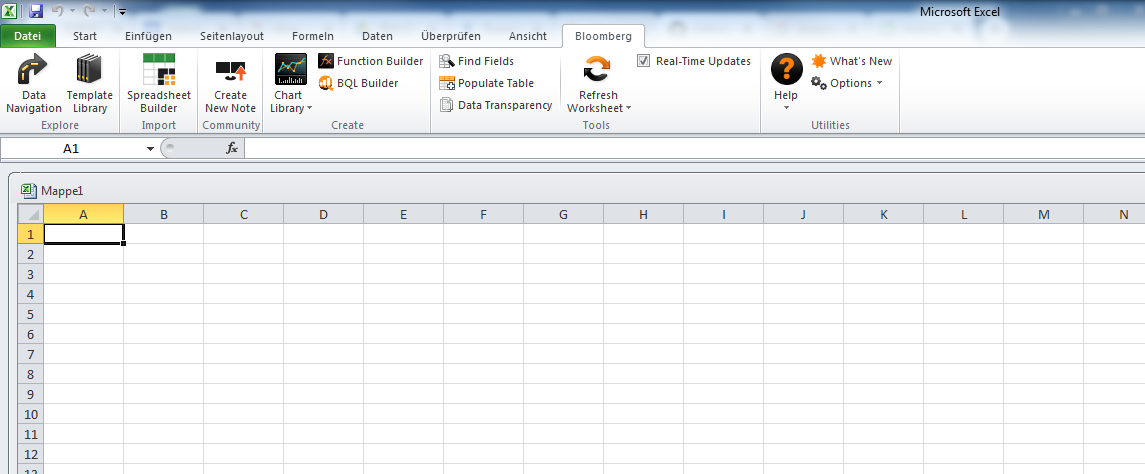
Figure 1: Bloomberg Add-in in Excel
Install Blommberg C++ SDK
-
Visit Bloomberg API Library and downlaod C++ Supported Release
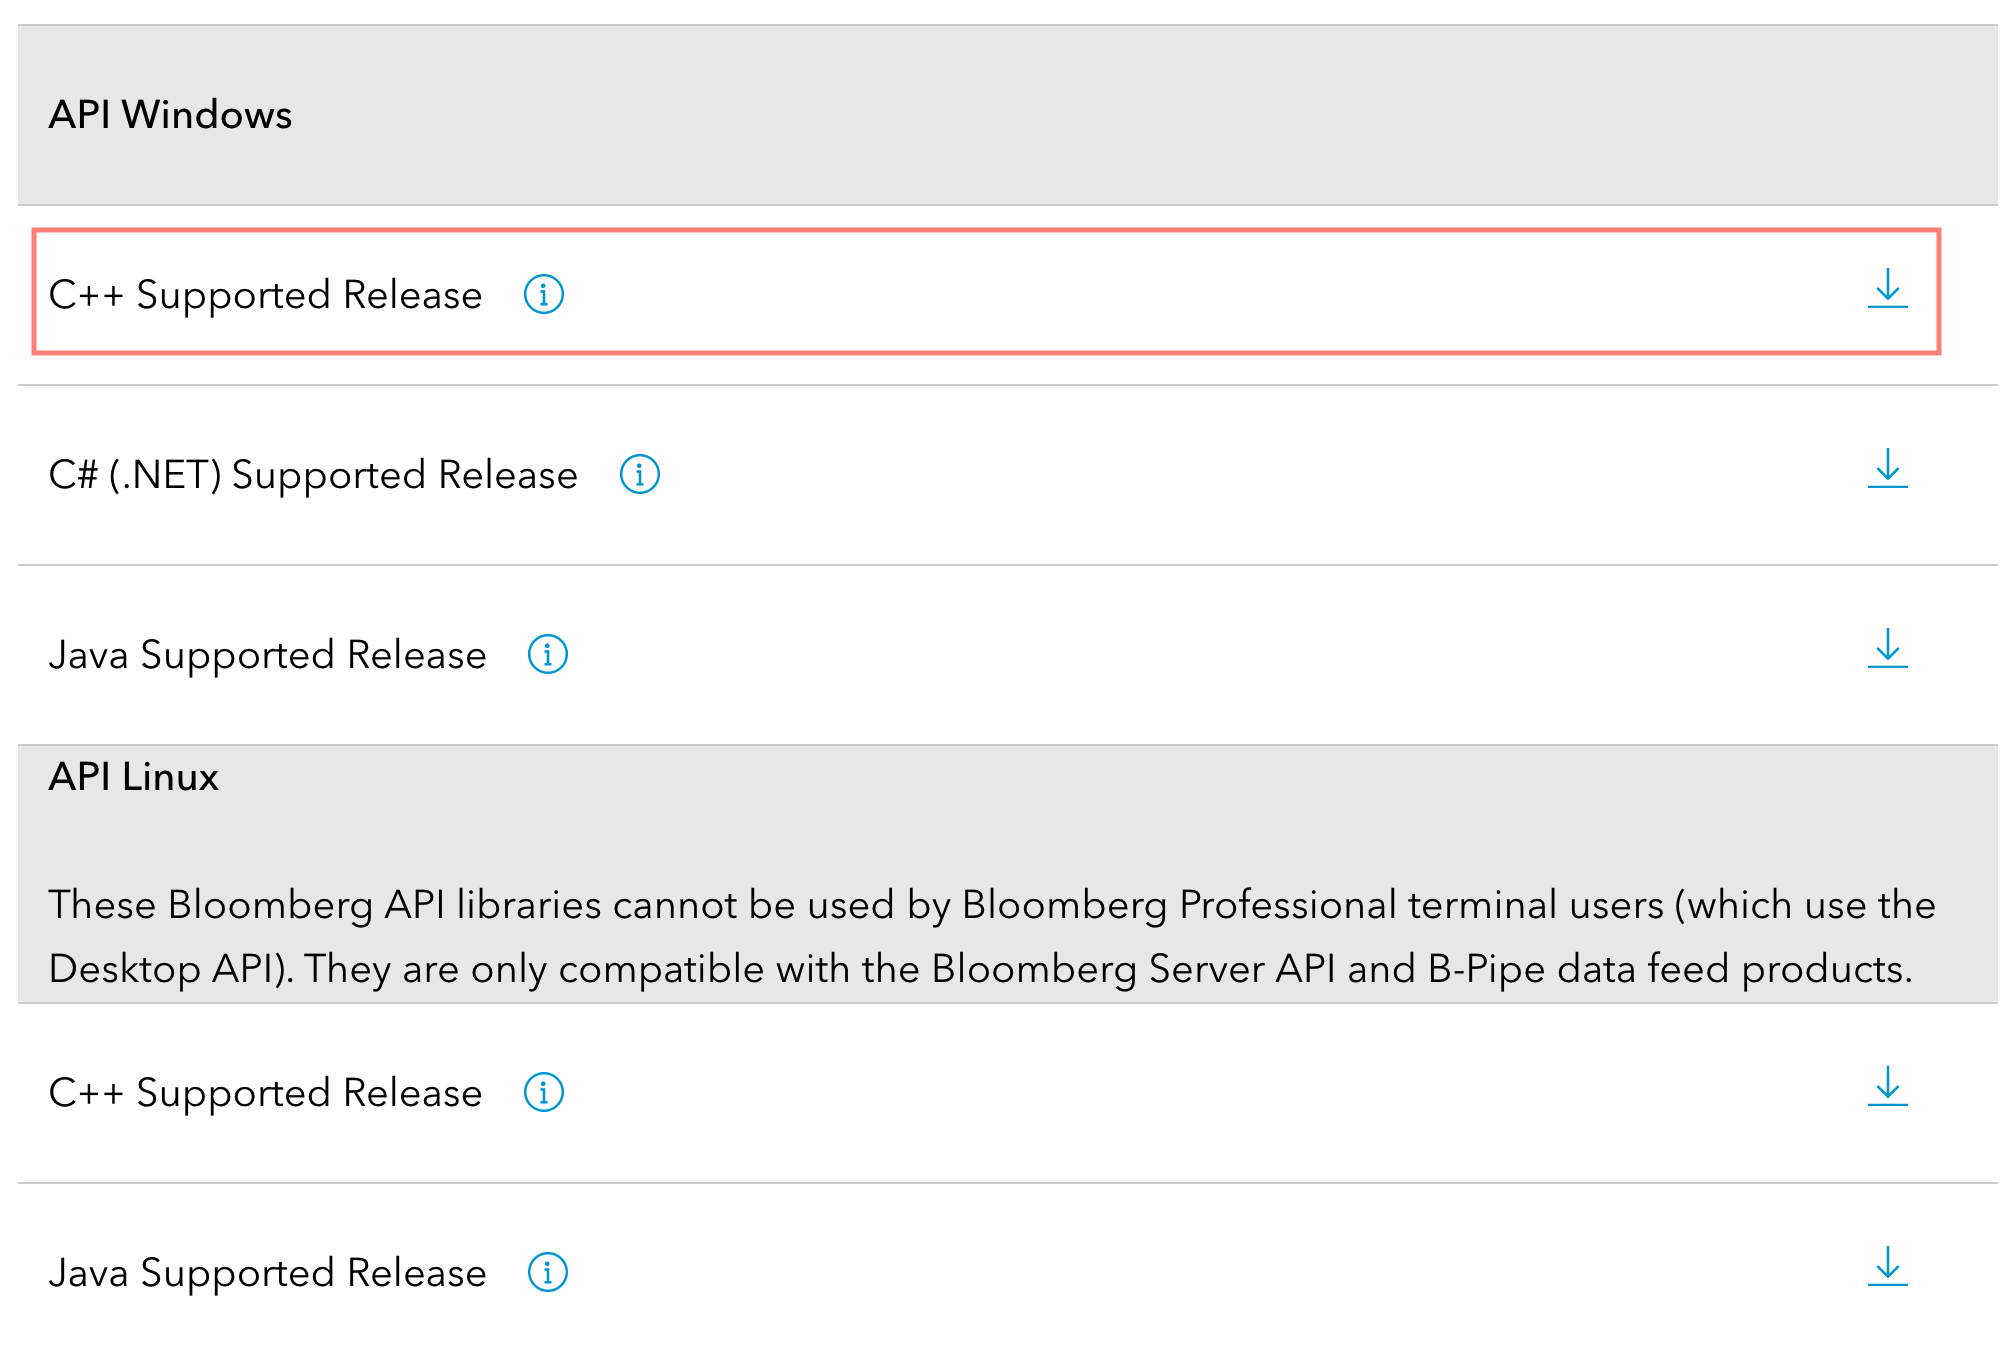
Figure 2: Bloomberg API Library -
Copy
blpapi3_32.dllandblpapi3_64.dllfrom thelibfolder of downloaded zip file (typically namedblpapi_cpp_3.16.6.1-windows.zip) to BloombergBLPAPI_ROOTfolder in the terminal (usuallyC:/blp/DAPI). If any note saying the files would be replaced appears, confirm the replacement.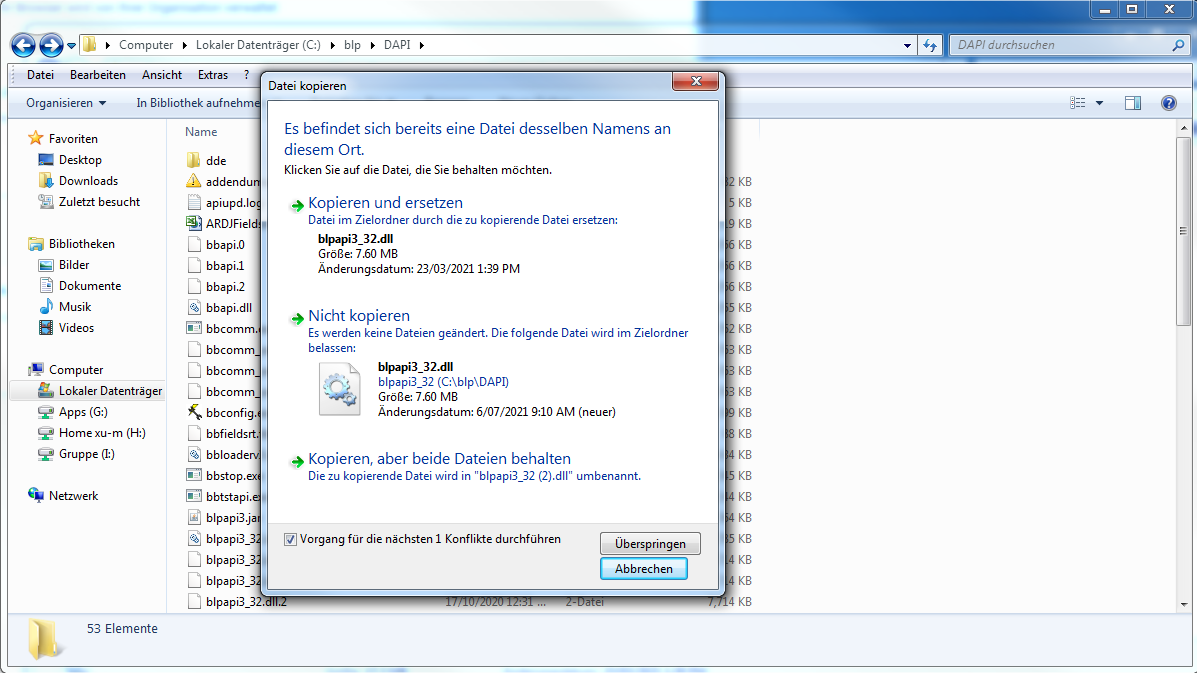
Figure 3: Replace Files in BlPAPI_Root -
Please make sure the Bloomberg App is closed before replacing those two root files.
Install Python/Anaconda
As Anaconda has integrated the majority of most frequently used Python packages, I would recommend installing Anaconda as a shortcut. If you choose to purely install Python, remember to click the option" Add Python into Enviornment Path" when installing to make sure your later procedures easier.
Suppose you’ve already installed Anaconda, launch the cmd from the navigator panel (or directly from the start menu).
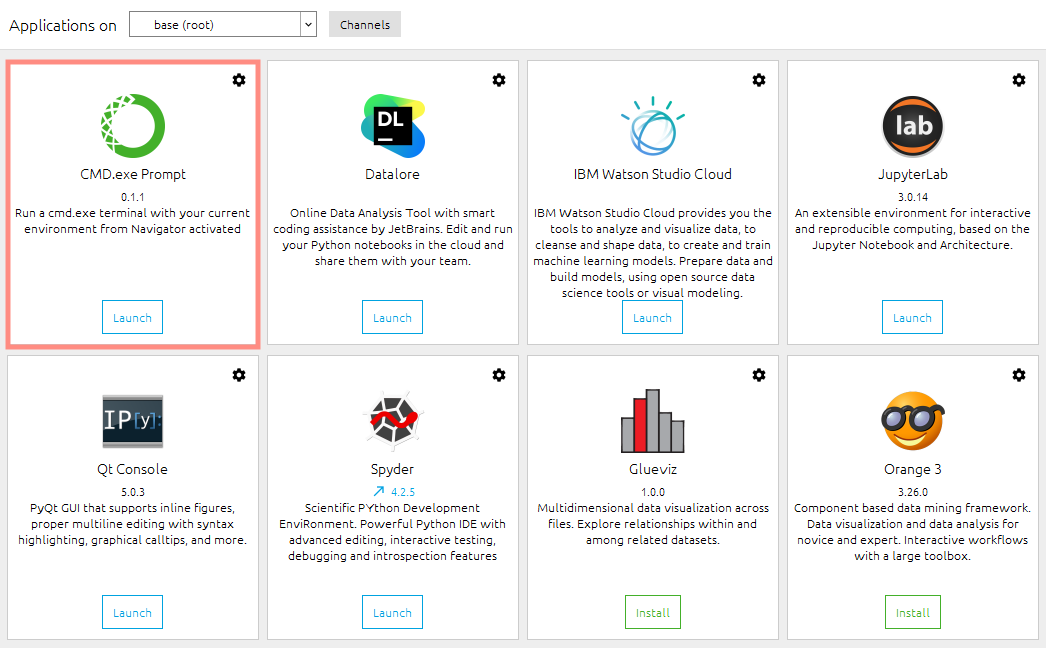
Install Necessary Packages
Type the following orders in the cmd window you launched from Anaconda Navigator.
-
Install Bloomberg official Python API
1pip install blpapi --index-url=https://bcms.bloomberg.com/pip/simple/ -
Install
numpy,pandas,ruamel.yamlandpayarrow. As Anaconda has integratednumpyandpandas, we only need to install the last two packages. -
Install a third-party package that enables better data extracting experience
xbbg1pip install xbbg
Login in Bloomberg Terminal
This steps activates your access to Bloomberg data and enables the following data extracting.
Test API
Type python in the cmd window, you will enter the Python enviornment. If you enter the following code and get the same result as mine, that means you’ve deployed the operation enviornment for Bloomberg API successfully. All of the following examples are obtained from the Github Page of xbbg.
|
|
BDP example:
|
|
BDP with overrides:
|
|
BDH example:
|
|
BDH example with Excel compatible inputs:
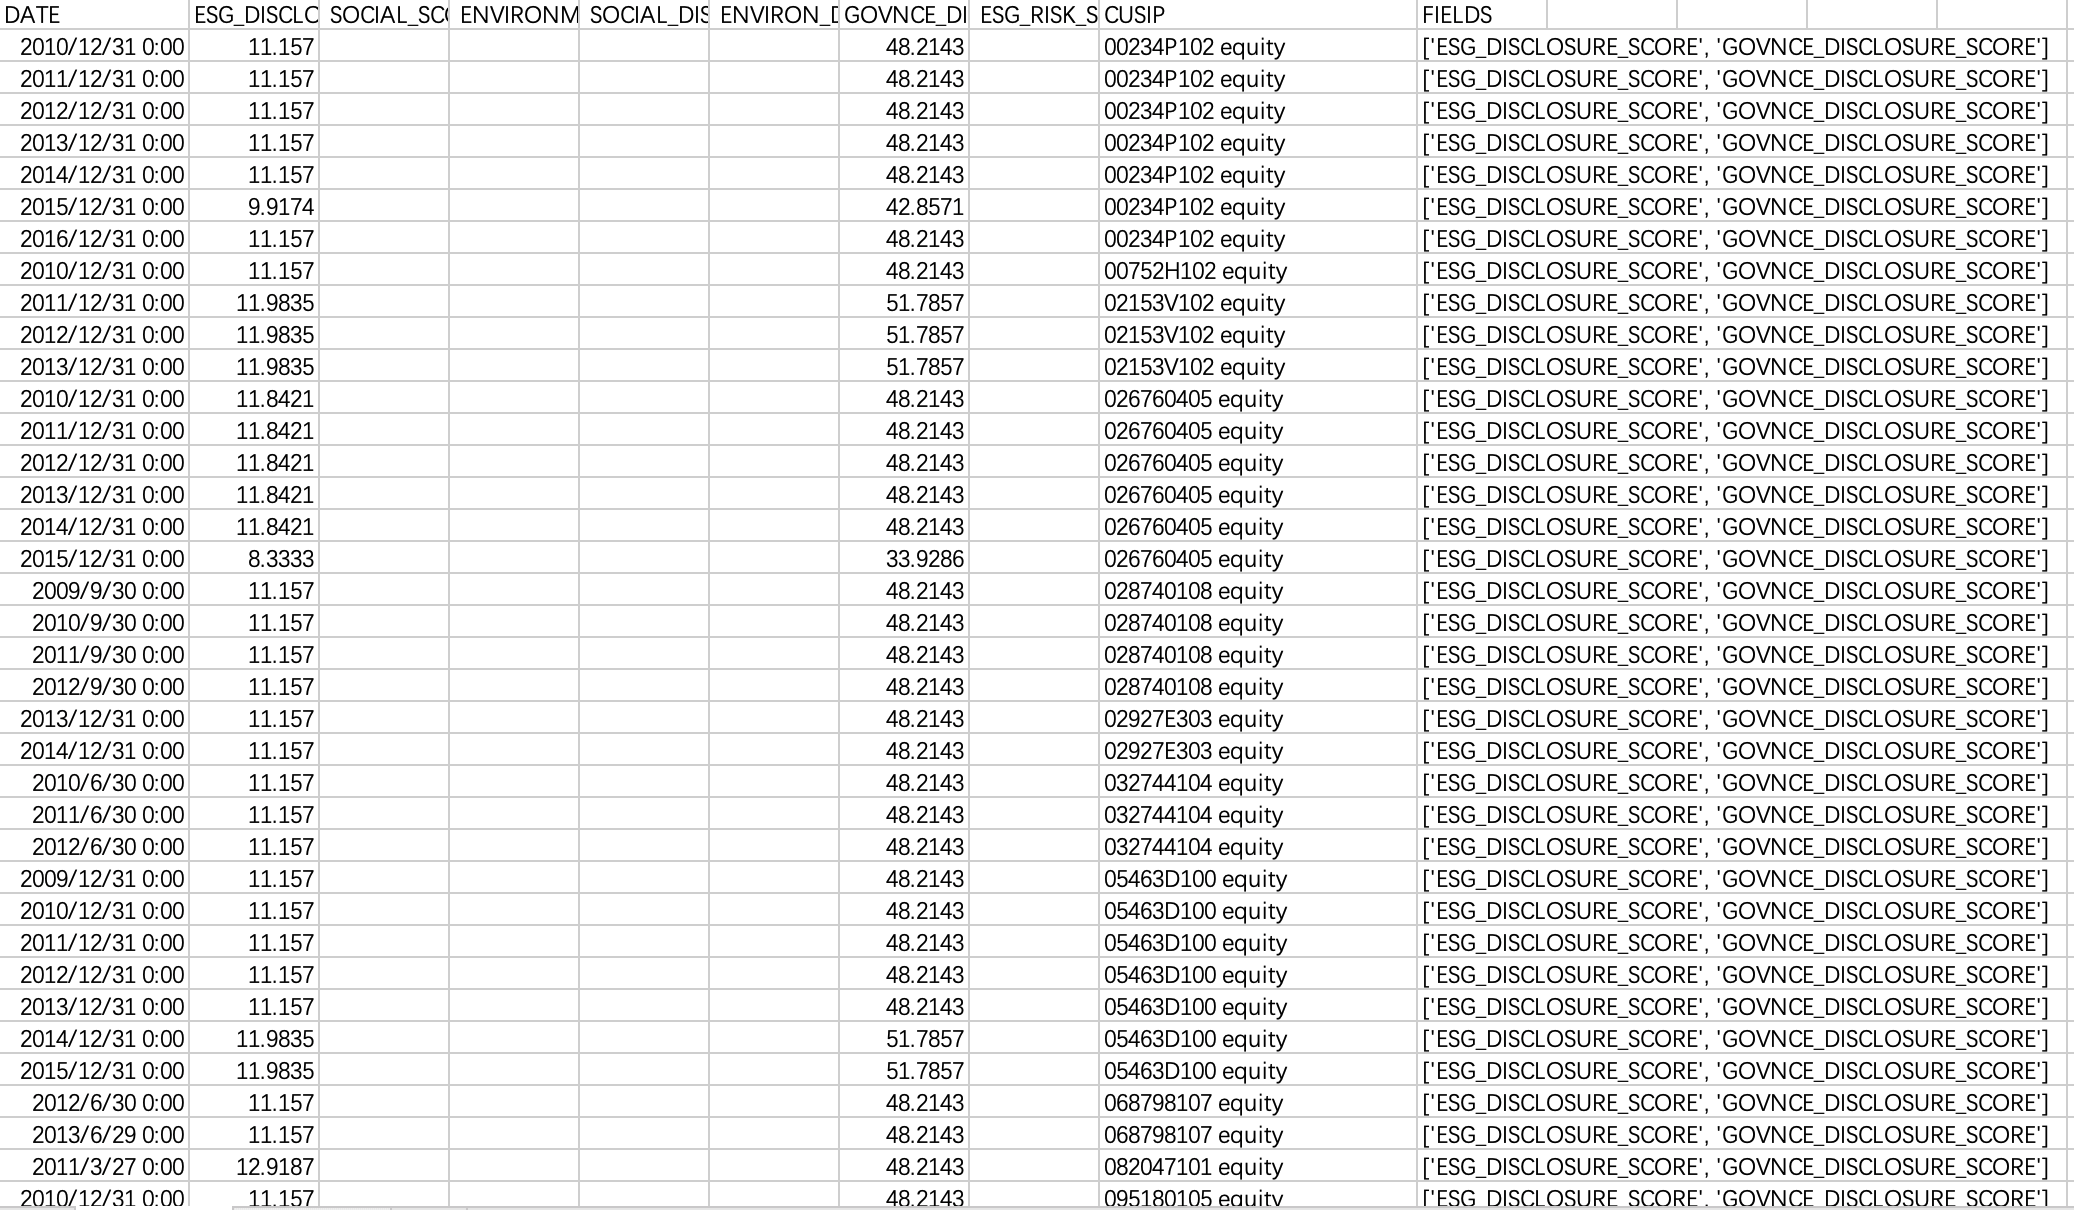
An Example : Extract ESG Disclosure Scores
Suppose we want to extract the ESG Disclosure Score for a list of 8000 securities via API. A very first obstacle is that we have no idea what does this variable is named in API and which function we should use to request the data. Thus, the first step is to obtain all those information you demand by building an example spreadsheet through Bloomberg Excel Add-in.
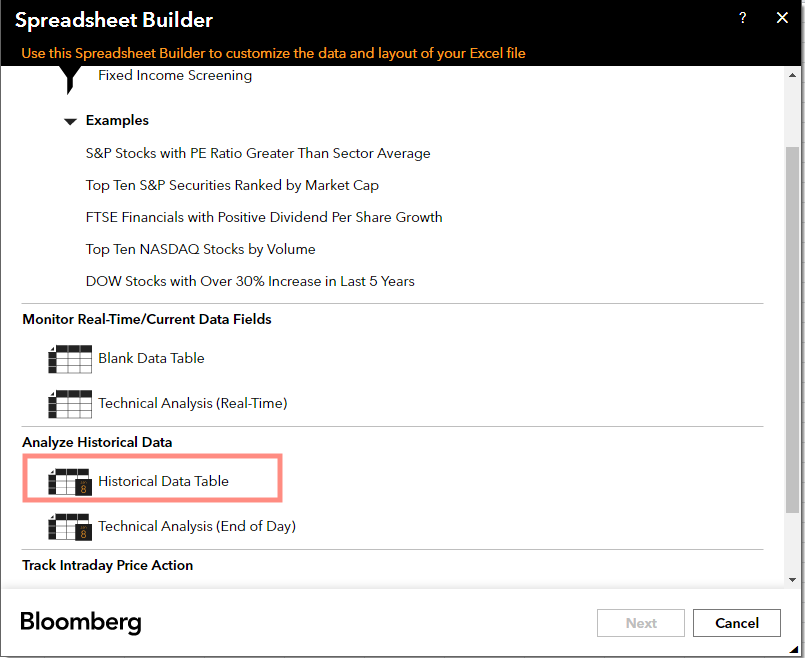
Get The Function Name and Key Parameters
Click the Spreadsheet Builder in Bloomberg Excel Add-in. Click Historical Data Table.
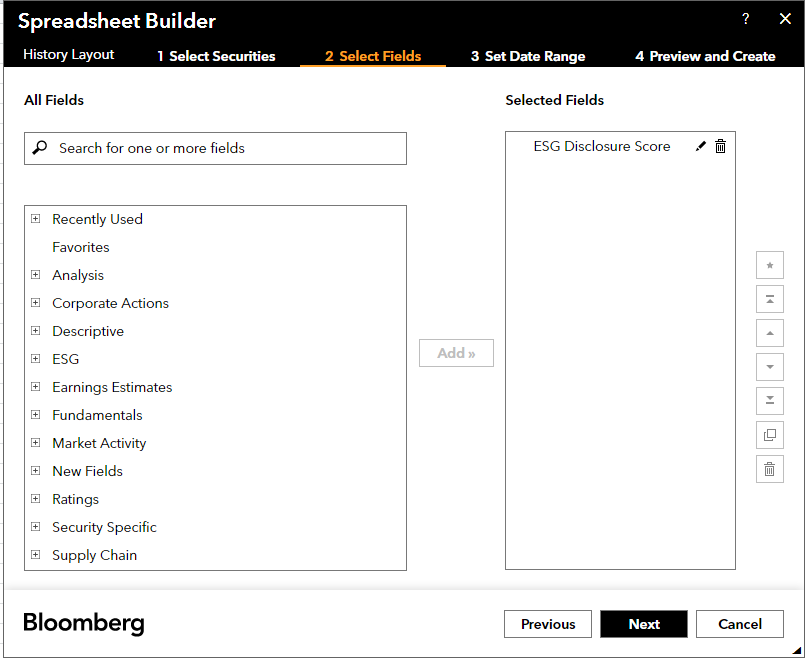
You can randomly pick one (or more) security. I would choose Apple (AAPL) here as an example. Then there appears a window where you can select fields you want.
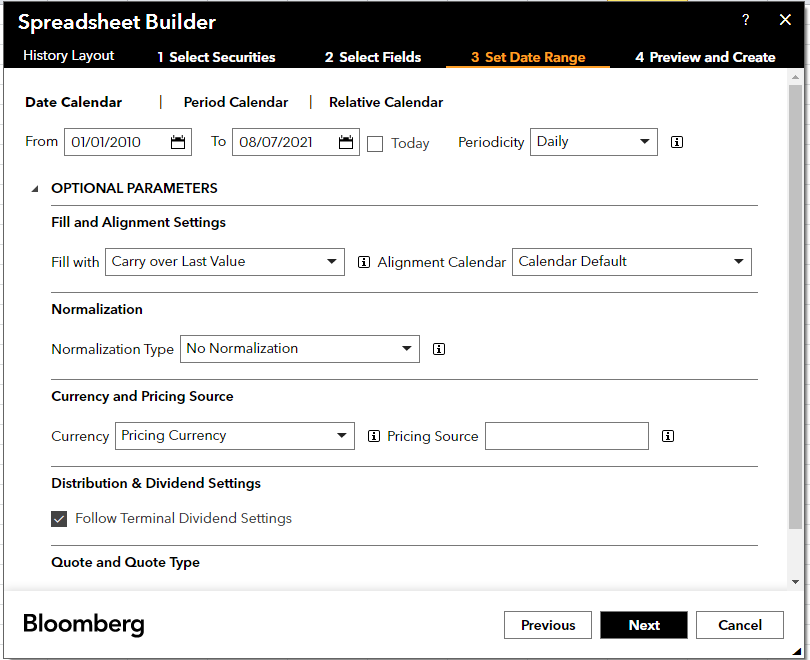
Then you can select the data range and periodicity. For variables like ESG Disclosure Score, we typically choose “Yearly”.
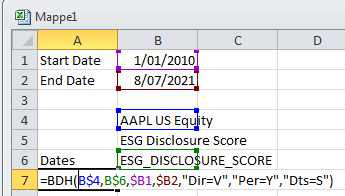
Finally, you will obtain the results. Click the cell exactly below Dates, you will get
- Function
bdh - Variable name
ESG_DISCLOSURE_SCORE - Equity Name
APPL US Equity - Start Date
1/01/2010 - End Date
8/07/2021 - Periodicity
Per=Y
With the above information, you can construct the function you need for extracting data via API.
Code
Purely Extract Single Variable
In this case, you only need to
- Prepare a cusip list
cusiplist.xlsx - Customize the key parameters as you need
- Searching start date
date_from - Searching end date
date_until - Searching variable name
target
- Searching start date
|
|
Extract Multiple Variables
As the institutional quota of request is monthly limited, it would be more efficient to request multiple variables together. In this case, you need to deal with a tricky situation. Suppose you request 7 variables for each firm, but some firm only has 4 variables valid while others have 5 variables valid. The distribution is random. API only returns the valid columns, which means the size of the returned dataframe and the order of the variable names could be random.
To deal with this situation, I write a function prepare() to pre-specify an order for all the requested variables to make sure the data returned for each variable should be written to the pre-specified column
-
For example, the data returned for
SOCIAL_SCOREis always written to the 3rd column while the data returned forENVIRON_DISCLOSURE_SCOREis always written to the 6th column -
If there is no data returned for a variable during one request, then write a blank stirng
""to the respect column
|
|
Sample Outcome