Motivation
Since retail investors’ last major moves on dot-com stocks in the late 1990s, they have been largely silent from the capital market for decades until the COVID time. Compared to previous retail trading waves, the recent retail influx is characterized by unprecedented market power, fueled by crowdsourced investing ideas from online forums, one-click trading convenience, and greater access to news outlets.
Looking back, many tend to attribute the recent retail influx to COVID, which left people stuck at home with ample time and extra cash from quarantine and layoff compensation. However, this cannot explain why retail investors have remained an influential force even after returning to the office.
Digging deeper, one may find that there is another major factor contributing to this wave of retail influx. In November 2019, major brokers such as Charles Schwab and Robinhood began offering fractional trading. Instead of requiring one share as the minimum purchase, brokers began allowing investors to buy fractional shares for as little as a penny. This is undoubtedly a game changer: it greatly lowered the entry barriers not only to expensive stocks that people couldn’t afford before, but also to the entire stock market.
One illustrative example from Da et al. (2024, RFS): With a single share trading well above a quarter of a million dollars, Berkshire Hathaway’s Class A stock (BRK.A) is commonly considered out of reach for most retail investors. However, as Figure 2 from Da et al. (2024, RFS) shows, the stock has experienced a sharp increase in Robinhood ownership since 2019.
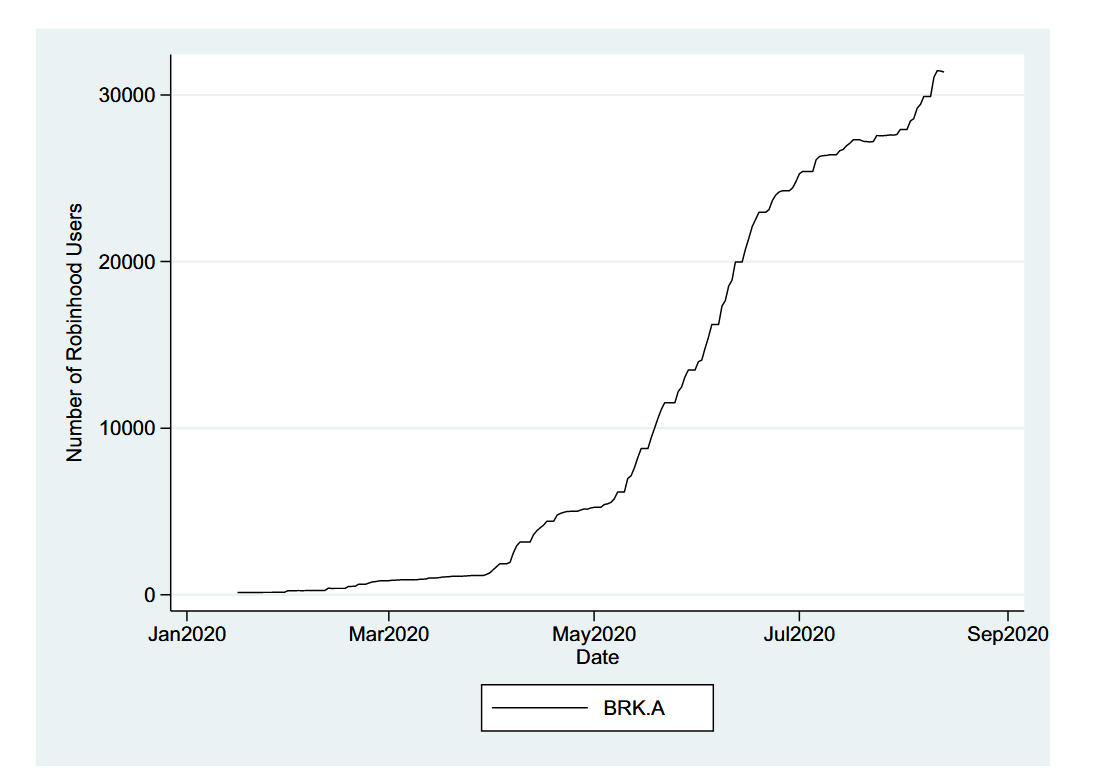
Though individually minimal, fractional trading—when coordinated during attention-grabbing events—is powerful enough to exert significant price pressure even on high-priced stocks, fueling meme-stock-like trading frenzies and bubbles (Da et al., 2024, RFS). Therefore, recognizing that this wave of retail influx is not a temporary byproduct of COVID, but rather a more prolonged fundamental change in market dynamics, is important for companies, institutional investors, and policymakers—many of whom seem to have already acknowledged and moved upon this “New normal.”
Recent studies suggest that institutional investors do not remain unchanged with the retail influx; they are found to ‘ride on the bubbles’ and systematically take advantage of the additional stock volatility brought by retail investors (Lin, 2024 WP, Fang et al., 2024 JFQA). In addition, institutional investors are shown to hold fewer shares and firms see less voting participation in shareholder meetings, suggesting that retail investors altered shareholder structures but cannot contribute to corporate governance the same way as their predecessors did (Aggarwal et al., 2024 WP). On the other hand, many companies realized that they cannot deter retail investors by maintaining an unaffordable stock price anymore but must carefully manage this new shareholder base to avoid potential backlashes (McCabe, 2020).
There are certainly more fascinating aspects we can explore about these ongoing market dynamics. To support these explorations, in this blog, I will follow Da et al. (2024, RFS) and introduce a method for quantifying firm-level daily exposure to fractional trading.
How Does Fractional Trading Manifest in the Order Book?
I follow Da et al. (2024, RFS) and rely on the off-exchange one-share trades to capture fractional trading. The rationales, according to Da et al. (2024, RFS), are as follows.
- Most retail investors place orders through online trading platforms like Robinhood, which bundle these orders and sell them to off-exchange market makers such as Virtu for internalization (Osipovich, 2021). These off-exchange trades are then reported to a Financial Industry Regulatory Authority (FINRA) Trade Reporting Facility (TRF), which can be identified from the order book.
- When reported to a FINRA TRF, the fractional orders appear as a one-share trades per the ‘rounding-up rule.’
Institutional background above, the algorithm to quantify fractional trading is extremely simple and intuitive:
- First, determine the set of stocks of interest—for example, S&P 500 firms—and the time frame, say 2020-01-01 to 2024-12-31.
- Second, identify the TRFs where fractional trading is likely to be reported. Following Da et al. (2024, RFS), the possible
TR_RFvalues in order book provided by WRDS-TAQ database are:- B = FINRA / NASDAQ TRF Chicago
- N = FINRA / NYSE TRF
- T = FINRA / NASDAQ TRF Carteret (CTA)
- Q = FINRA / NASDAQ TRF Carteret (UTP)
- Third, extract one-share trades from the orders reported to the TRFs listed above—that’s the fractional trading you’re aiming to capture.
Although algorithmically simple, the calculation of fractional trading can be computationally intensive and time-consuming, as it requires iterating huge daily order books from 2020 to 2024. Given this, I highly recommend deploying this task as a batched job on the WRDS cloud instead of running it with PC SAS.
Step 1: Extract S&P 500 stock symbols
The S&P 500 firm list is provided by the CRSP database with permno as the identifier. I merged it with the WRDS CRSP-TAQ linking table to obtain the stock symbols. As the S&P 500 list can change over time, I only keep firms included in the index as of Dec 31, 2019.
|
|
To increase data extraction efficiency, I combined the symbols of S&P 500 firms into a single string, with each symbol wrapped in quotes, and then assigned this string to the macro variable ticlist_formatted.
Step 2: Extract & Aggregate Fractional Trading
Before we begin extracting trading data, we need to create an empty dataset—let’s call it spft_2020_2024. All newly extracted trading data will be saved to this dataset day by day without generating separate output files.
Next, we define a function to extract fractional trading for targeted stocks on a given day from the corresponding order book, and then aggregate the number of fractional trades num_ft and total trades num_trd per stock per day. One may also calculate price high and low (maxprice and minprice).
|
|
Once the function getsp for processing daily order books is defined, we can proceed to run it day by day within our specified time frame: 2020-01-01 to 2024-12-31.
|
|
By design, if the code runs smoothly, our fractional trading calculations will be integrated into spft_2020_2024.sas7bdat in the home directory.
Step 3: Deploy the Batched Job in WRDS Cloud
Given the substantial volume of data involved, I highly recommend packaging the code and running it as a batched job in WRDS Cloud. This approach offers several benefits: freeing up your PC’s resources for other tasks, avoiding inefficient data transfers between your PC and WRDS, and leveraging the computational power of WRDS Cloud to accelerate the calculation.
In my earlier blog post, “Exploit WRDS Cloud via Python”, I introduced how to connect to WRDS Cloud via SSH, link WRDS to your Dropbox account for convenient file exchanges, and deploy batch jobs there. Readers interested in more details can refer to that post. In this post, I assume you’ve already linked your WRDS Cloud to your Dropbox, and I’ll provide another example of how to deploy a batch job to WRDS Cloud—and why you might want to do that.
As a preparatory step, I batched the following code into a SAS file named testft.sas, which is available at this link. Download this SAS file to the root directory of your Dropbox folder to proceed.
|
|
To deploy it to WRDS Cloud, we need:
-
Open Windows command line or Mac Terminal, and connect WRDS Could through
ssh.1ssh yourwrdsusername@wrds-cloud.wharton.upenn.eduSuccessful connection will give you:
1[yourwrdsusername@wrds-cloud-login1-w ~]$ -
Upload
testft.sasfrom Dropbox to the home directory of the WRDS Cloud1[yourwrdsusername@wrds-cloud-login1-w ~]$ dbxcli get testft.sas . -
Run
testft.sasin WRDS Cloud
You can check the job status with qstat and view the SAS running logs with cat check testft.log. If the logs indicate that the code is running smoothly, you can enjoy your break (or evening) and harvest your data a while later.
Step 4: Harvest Data From WRDS Cloud
I had this batched job running in WRDS before I left work, and harvested the data the next morning. The running log suggests that it takes 8:09:35.93 to finish this batched job, and there are 774485 observations collected into spft_2020_2024.sas7bdat.
|
|
Now it’s time to harvest your fractional trading measures! Remember, if the code runs smoothly, the fractional trading calculations will be integrated into spft_2020_2024.sas7bdat in your home directory of the Cloud. You can use ls to check whether the dataset has appeared there. If it has, simply download spft_2020_2024.sas7bdat to your Dropbox folder. In my case, I would like to place it in /Blogbackup/blogdata, so my code is as follows:
The output dataset is as follows.
| SYM_ROOT | DATE | SYM_SUFFIX | numt_trd | num_ft | maxprice | minprice |
|---|---|---|---|---|---|---|
| A | 20200102 | 15694 | 108 | 86.35 | 85.03 | |
| AA | 20200102 | 19189 | 64 | 21.86 | 21 | |
| AAL | 20200102 | 38034 | 358 | 29.3 | 28.65 | |
| AAP | 20200102 | 12278 | 199 | 161 | 157.53 | |
| AAPL | 20200102 | 283484 | 10634 | 311.9366 | 289.44 | |
| ABBV | 20200102 | 45884 | 927 | 89.73 | 88.51 | |
| ABC | 20200102 | 11450 | 130 | 86.39 | 84.3201 | |
| … | … | … | … | … | … | |
| YUM | 20241231 | 22099 | 2993 | 136.46 | 130 | |
| ZBRA | 20241231 | 12417 | 1678 | 397.87 | 380.02 | |
| ZION | 20241231 | 15955 | 1274 | 55.7 | 53.94 | |
| ZION | 20241231 | P | 62 | 0 | 24.99 | 22.61 |
| ZTS | 20241231 | 24746 | 2820 | 178.78 | 160.01 |
If you have multiple files with similar names and find downloading them one by one time-consuming, I recommend writing a bash script to automate the task. Simply save the following shell script as a bash file named syncwrds.sh and upload this bash file to WRDS Cloud in the same way you upload a SAS file.
|
|
As syncwrds.sh is in DOS/Windows format and WRDS Cloud uses Unix/Linux format, we need to run the dosunix command to convert the line endings.
Now you’re ready to batch-download files from WRDS to your Dropbox folders! For example, if I want to download all files with names containing the word get to my local Dropbox folder .\Dropbox\Blogbackup\blogdata, I simply run the bash file syncwrds.sh as follows.
|
|
It will ask you to enter the directory where you want to download the data, to which I enter /Blogbackup/blogdata, and then ask for the keyword that filenames should contain, to which I enter get. All files in your WRDS Cloud that satisfy this criterion and do not already exist in /Blogbackup/blogdata will then be uploaded to your designated local Dropbox folder /Blogbackup/blogdata.
|
|
Discussion
Note that the calculation method in this post is relatively rough, as it cannot distinguish literal ‘off-exchange one-share’ trades from fractional trades—they appear identical in the order book. For those who prefer more precise measures of fractional trading, I recommend Bartlett et al. (2024 JFE). According to this study, it is technologically feasible to leverage the latency between order submission and execution to more accurately identify fractional trading.
On the other hand, the imperfection of the calculation method in this blog post creates unique research opportunities: Although ‘real fractional trading’ only appears after November 2019, using ‘off-exchange one-share trades’ as a proxy for fractional trading allows researchers to observe ‘placebo’ fractional trades prior to 2019, which bodes well for the design of quasi-natural experiments.
A powerful case comes from Da et al. (2024, RFS), who find that, relative to cheap stocks (e.g., lower than $80 per share), more expensive ones attracted more fractional trading after November 2019. This finding supports the idea that fractional trading relaxes investors’ capital constraints and allows them to invest in stocks they could not afford without the option to buy in slices.
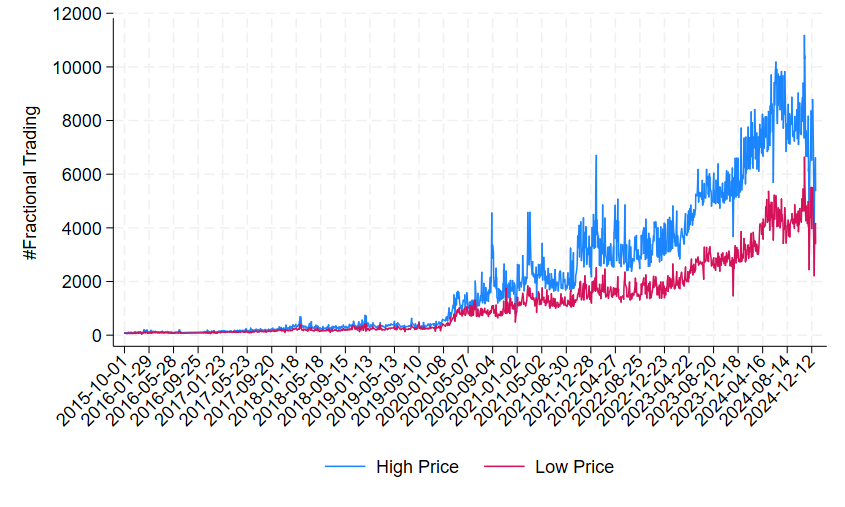
Last but not least, by plotting the trend of ‘placebo’ fractional trading before November 2019 and the real such trading afterward, one may find that the measurement error of using off-exchange one-share trades as a proxy for fractional trading is reasonably acceptable: at least before November 2019, the number of literal off-exchange one-share trades appears to be minimal.
Conclusion
In this blog post, I follow Da et al. (2024, RFS) and present a workflow for calculating off-exchange one-share trading as a proxy for fractional trading, which has been shown to be market-moving during attention-grabbing events or under savvy coordination. Although more precise measures exist, this relatively rough proxy has an acceptable measurement error and offers additional identification advantages for researchers.
References
- Aggarwal, D., A. H. Choi, Y.-H. A. Lee. 2024. Retail Investors and Corporate Governance: Evidence from Zero-Commission Trading.
- Bartlett, R. P., J. McCrary, M. O’Hara. 2024. Tiny trades, big questions: Fractional shares. Journal of Financial Economics 157: 103836.
- Da, Z., V. W. Fang, W. Lin. 2024. Fractional Trading. The Review of Financial Studies.
- Fang VW, Madsen J, Shao X. Is It all Noise? The Microstructure Implications of Corporate Recurring Advertisements. Journal of Financial and Quantitative Analysis.
- Lin, W. 2024. Strategic Informed Trades and Tiny Trades.
- McCabe, C. 2020. New army of individual investors flexes its muscle. Wall Street Journal .
- Osipovich, A., L. Beilfuss. 2019. Schwab Cuts Fees on Online Stock Trades to Zero, Rattling Rivals. Wall Street Journal .